TECHNICAL CASE STUDY · Research · Chain forensics
Historical gas-fee investigation
Reconstruct the data. Explain the anomaly.
Completed historical investigation · retained reproducible artifacts
FROM THE IMPLEMENTATION
Make the chart timezone explicit
def load_minutes() -> list[dict[str, object]]:
    buckets: dict[str, list[int]] = defaultdict(list)
    with open(BLOCKS_CSV) as fh:
        for row in csv.DictReader(fh):
            ts = int(row["unix_ts"])
            minute = datetime.fromtimestamp(ts, tz=CET).strftime("%Y-%m-%d %H:%M")
            buckets[minute].append(int(row["base_fee_wei"]))
    rows: list[dict[str, object]] = []
    for minute in sorted(buckets):
fees = buckets[minute]Raw timestamps are grouped into explicitly zoned minute buckets. Keeping this transformation reproducible helps separate a timezone error from a real fee change. Selected source excerpt.
THE ENGINEERING PROBLEM
What needed to work
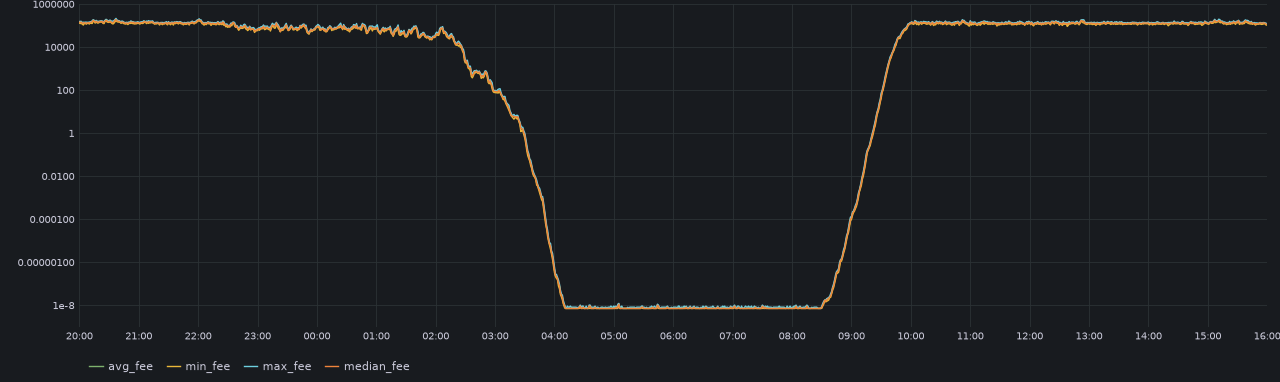
A historical gas-fee chart showed an extreme collapse and recovery. I needed to determine whether it reflected chain behavior, a timezone mismatch or corrupted data, then explain what its fee metric actually measured.
Constraints and requirements
- The screenshot supplied visual evidence, not a documented query or timezone.
- Base fee, priority bids and effective transaction price describe different quantities.
- The investigation covers a fixed December 25–26, 2023 window; it is not live telemetry.
ARCHITECTURE & DESIGN
How the system fits together
- Archive RPC + bounded block range
- Timestamped block headers
- CSV + minute statistics
- Time / fee definition comparison
- Reconstructed chart
Archive RPC → Python header collection → per-block CSV → minute aggregates → reconstructed chart and side-by-side comparison.
Collection preserves timestamps, integer wei fees, gas used and gas limits, with UTC and CET representations alongside the Unix timestamp.
Rendering consumes retained CSV separately from collection, allowing the chart to be rebuilt without the original endpoint.
Decisions and tradeoffs
Test the timezone with threshold crossings.
Matching several changes in the curve is stronger evidence than matching one tooltip or choosing the offset that looks plausible.
Tradeoff Screenshot readings have limited pixel and time precision.
Separate block base fee from transaction effective price.
Header values reconstruct the visible curve; recorded receipt checks show priority bidding can produce much higher prices paid.
Tradeoff A base-fee chart cannot describe every transaction’s total fee.
Keep collection small and reconstruction inspectable.
The collector uses standard-library Python, batches of 100 and bounded retries; explicit CSV fields expose units and aggregation.
Tradeoff Fresh collection needs an archive provider; plotting adds dependencies.
PLANNING & EXECUTION
From requirements to working behavior
- Located the time boundary with block-timestamp search and retained 7,155 headers.
- Computed per-minute minimum, mean, median and maximum base fees.
- Recreated the logarithmic scale and compared the result with the original screenshot.
VALIDATION & RECOVERY
How the behavior is checked
- Recorded seven downward threshold comparisons agree within 85 seconds under CET.
- Retained headers include gas utilization, supporting inspection of the low-fee interval.
- Findings preserve receipt comparisons that distinguish effective price from base fee.
- CSV inputs, aggregation code and plotting code remain available for reproduction.
Implementation references
Repository-relative references identify the implementation behind this case study. Selected code excerpts are also available in the portfolio.
- scripts/gas-cost-investigation/README.md
- scripts/gas-cost-investigation/findings.md
- scripts/gas-cost-investigation/scripts/fetch_window.py
- scripts/gas-cost-investigation/scripts/build_chart.py
- scripts/gas-cost-investigation/data/blocks_gas.csv
- scripts/gas-cost-investigation/data/minute_stats.csv